Let's Recommend a Good Spotify Playlist...
In this blog, I will be showing how I built a song recommender based on the user's music taste based on the playlist they often would listen to.
Music plays an integral role in our life right. It's there to lift our moods whenever we have a "Bad Day" (Song by David Powter btw) or when we need to just chill and code like in our case. So without wasting any time, I thought to build a recommendation engine to recommend me a new playlist based on my current playlist just as a simple fun project to do this weekend. So this is going to be more of a journal or a report of my project wherein I'll just write what I understand and what steps I am taking to build this project.
Step 1: Using The Spotify API
You can follow the following link to get started but I'll just briefly tell how I did to get myself started here.
Just go to the "Spotify for Developers" page and Log In using your Spotify account.
Then at the dashboard, you can create a new app.
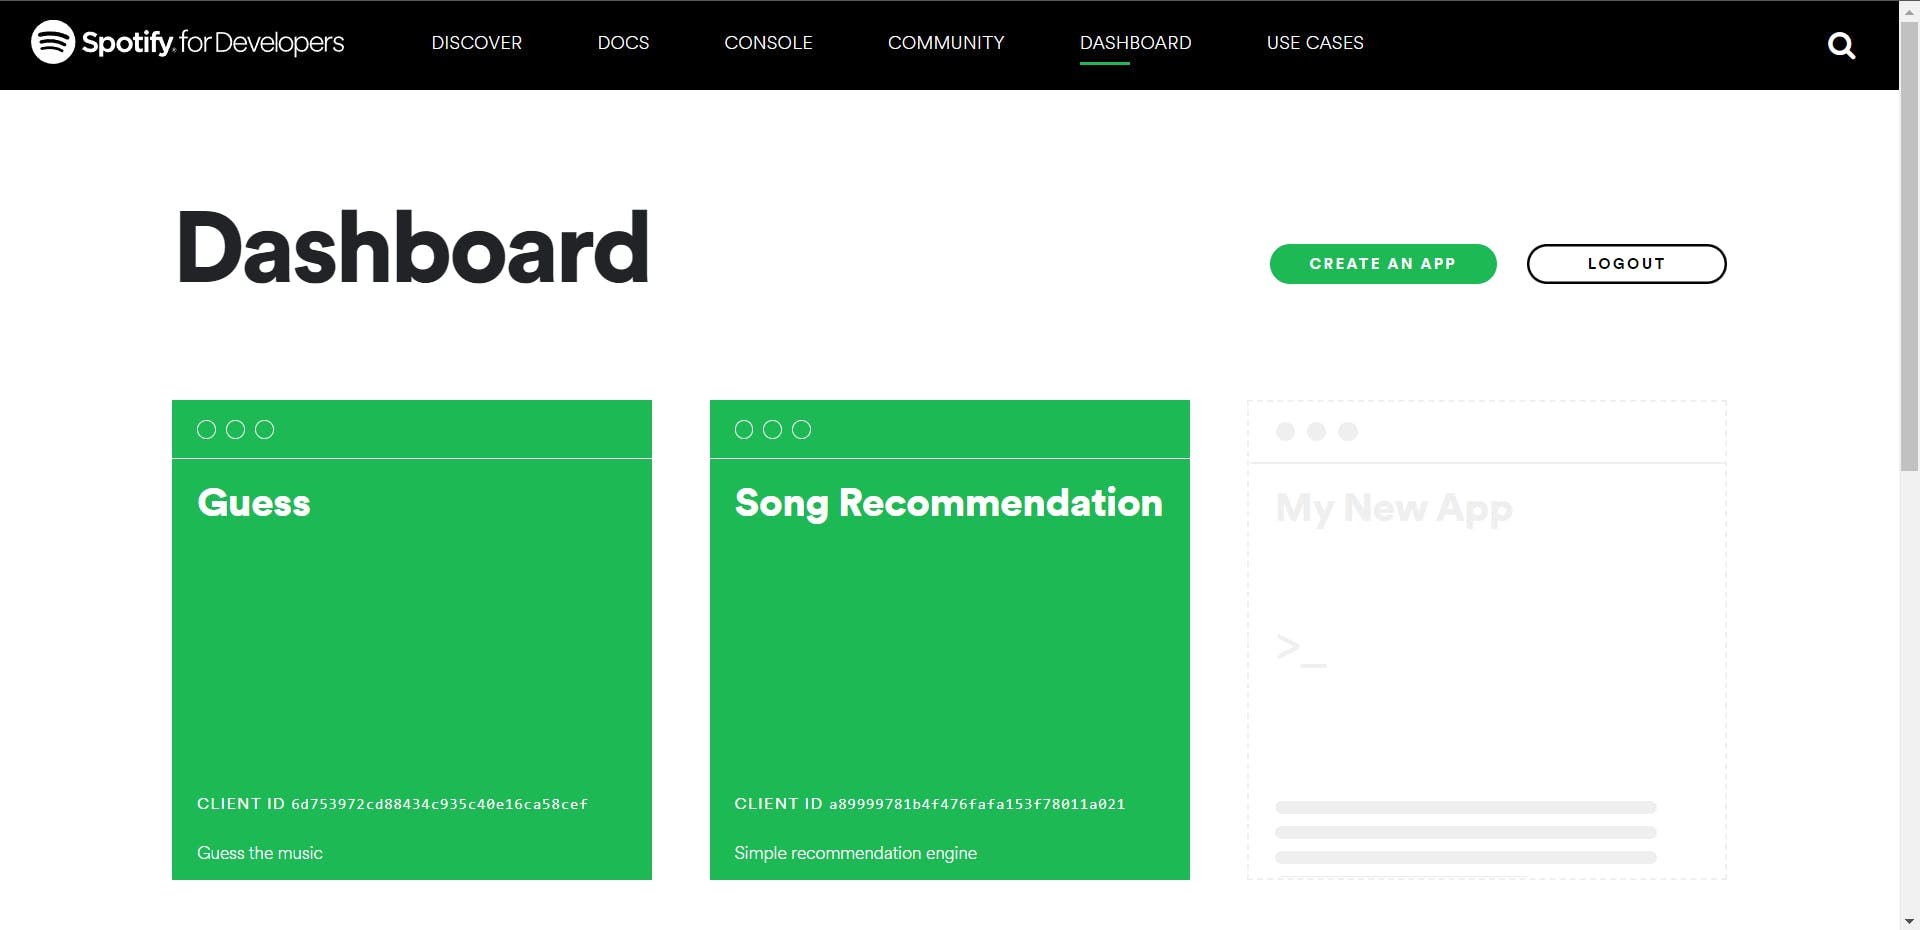
In the settings of your app, you can just give a redirect uri, my settings are given below:-

Now, I just imported some basic libraries and created a Spotify instance with my credentials(which you get from your app's dashboard) which will be authenticated using the OAuth flow.
import json
from spotipy.oauth2 import SpotifyClientCredentials
import pandas as pd
import numpy as np


clientID = 'Your Client ID'
clientSecret = 'Your Client secret'
client_credentials_manager = SpotifyClientCredentials(clientID, clientSecret)
sp = spotipy.Spotify(client_credentials_manager=client_credentials_manager)
For now, I am not using the recommended auth flow method of getting the access token and then verifying it because I do not want the more extensive scope like reading the current user's top song or so but feel free to use any method here.
Step 2: Understanding My Playlist Data
This is now a crucial step as this will allow me to decide what parameters to consider and not to consider when suggesting some new music to someone based on their playlist I want it to be good recommendations so that every user using my recommender should feel that the song is well suited to their taste.

So I did some deep analysis of all the tracks I got, I visualized the data too to understand better and went on to even analyze the features in the tracks that are common like loudness, acoustics, instrumentals and more.
You can get the playlist data like this:-
playlist_link = "https://open.spotify.com/playlist/79z9i0bjEBetmjtDAg2r7B"
playlist_URI = playlist_link.split("/")[-1].split("?")[0]
results = sp.playlist(playlist_URI)
Then I created my dataset with all required parameters like this:-
# create a list of song ids
ids=[]

for item in results['tracks']['items']:
        track = item['track']['id']
        ids.append(track)

song_meta={'id':[],'album':[], 'name':[],
           'artist':[],'explicit':[],'popularity':[],
           'release_date':[] }

for song_id in ids:
    # get song's meta data
    meta = sp.track(song_id)
    # song id
    song_meta['id'].append(song_id)

    # album name
    album=meta['album']['name']
    song_meta['album']+=[album]

    # song name
    song=meta['name']
    song_meta['name']+=[song]

    # artists name
    s = ','
    artist=s.join([singer_name['name'] for singer_name in meta['artists']])
    song_meta['artist']+=[artist]

    # explicit: lyrics could be considered offensive or unsuitable for children
    explicit=meta['explicit']
    song_meta['explicit'].append(explicit)

    # song popularity
    popularity=meta['popularity']
    song_meta['popularity'].append(popularity)

    #song release data
    release = meta['album']['release_date']
    song_meta['release_date'].append(release)


song_meta_df=pd.DataFrame.from_dict(song_meta)

# check the song feature
features = sp.audio_features(song_meta['id'])
# change dictionary to dataframe
features_df=pd.DataFrame.from_dict(features)

# convert milliseconds to mins
# duration_ms: The duration of the track in milliseconds.
# 1 minute = 60 seconds = 60 × 1000 milliseconds = 60,000 ms
features_df['duration_ms']=features_df['duration_ms']/60000

# combine two dataframe
final_df=song_meta_df.merge(features_df)
I also separated the numeric data columns like this:-
num_des_df = final_df[['danceability','loudness','energy','speechiness','acousticness','instrumentalness','liveness','valence','tempo','duration_ms']]
Then I normalized my numeric dataset above as every feature has a varied scale so hence bringing them to one normalized scale is important. I used Mix-Max Scaling here. MinMax Scaler shrinks the data within the given range, usually from 0 to 1. It transforms data by scaling features to a given range. It scales the values to a specific value range without changing the shape of the original distribution.
#Data Normalization using Min-Max Scaling
from sklearn.preprocessing import MinMaxScaler
min_max_scaler = MinMaxScaler()
num_des_df.loc[:]=min_max_scaler.fit_transform(num_des_df.loc[:])
Then I made a radar chart with all these features of tracks from the playlist I often listen to.
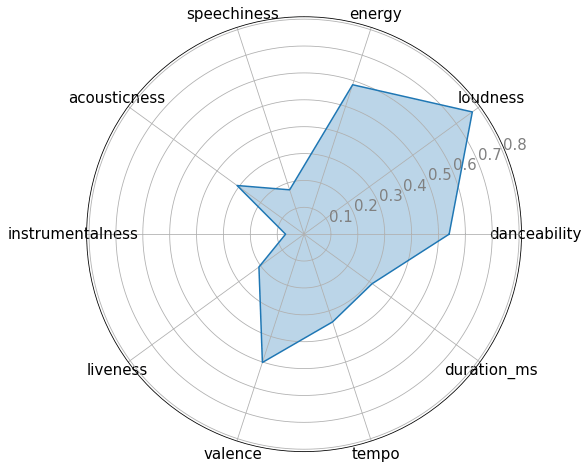
As you can see, I like songs with a good amount of loudness and energy and catchy songs to which you can dance and also I like songs with positive vibes (see the valance area in the chart) and which generally have acoustic instruments like guitar, flutes and all instead of digital sounds.
With this simple chart, we were able to know so much about my taste. But let's take this further.
Here I also draw a histogram of all the features in the original dataset.
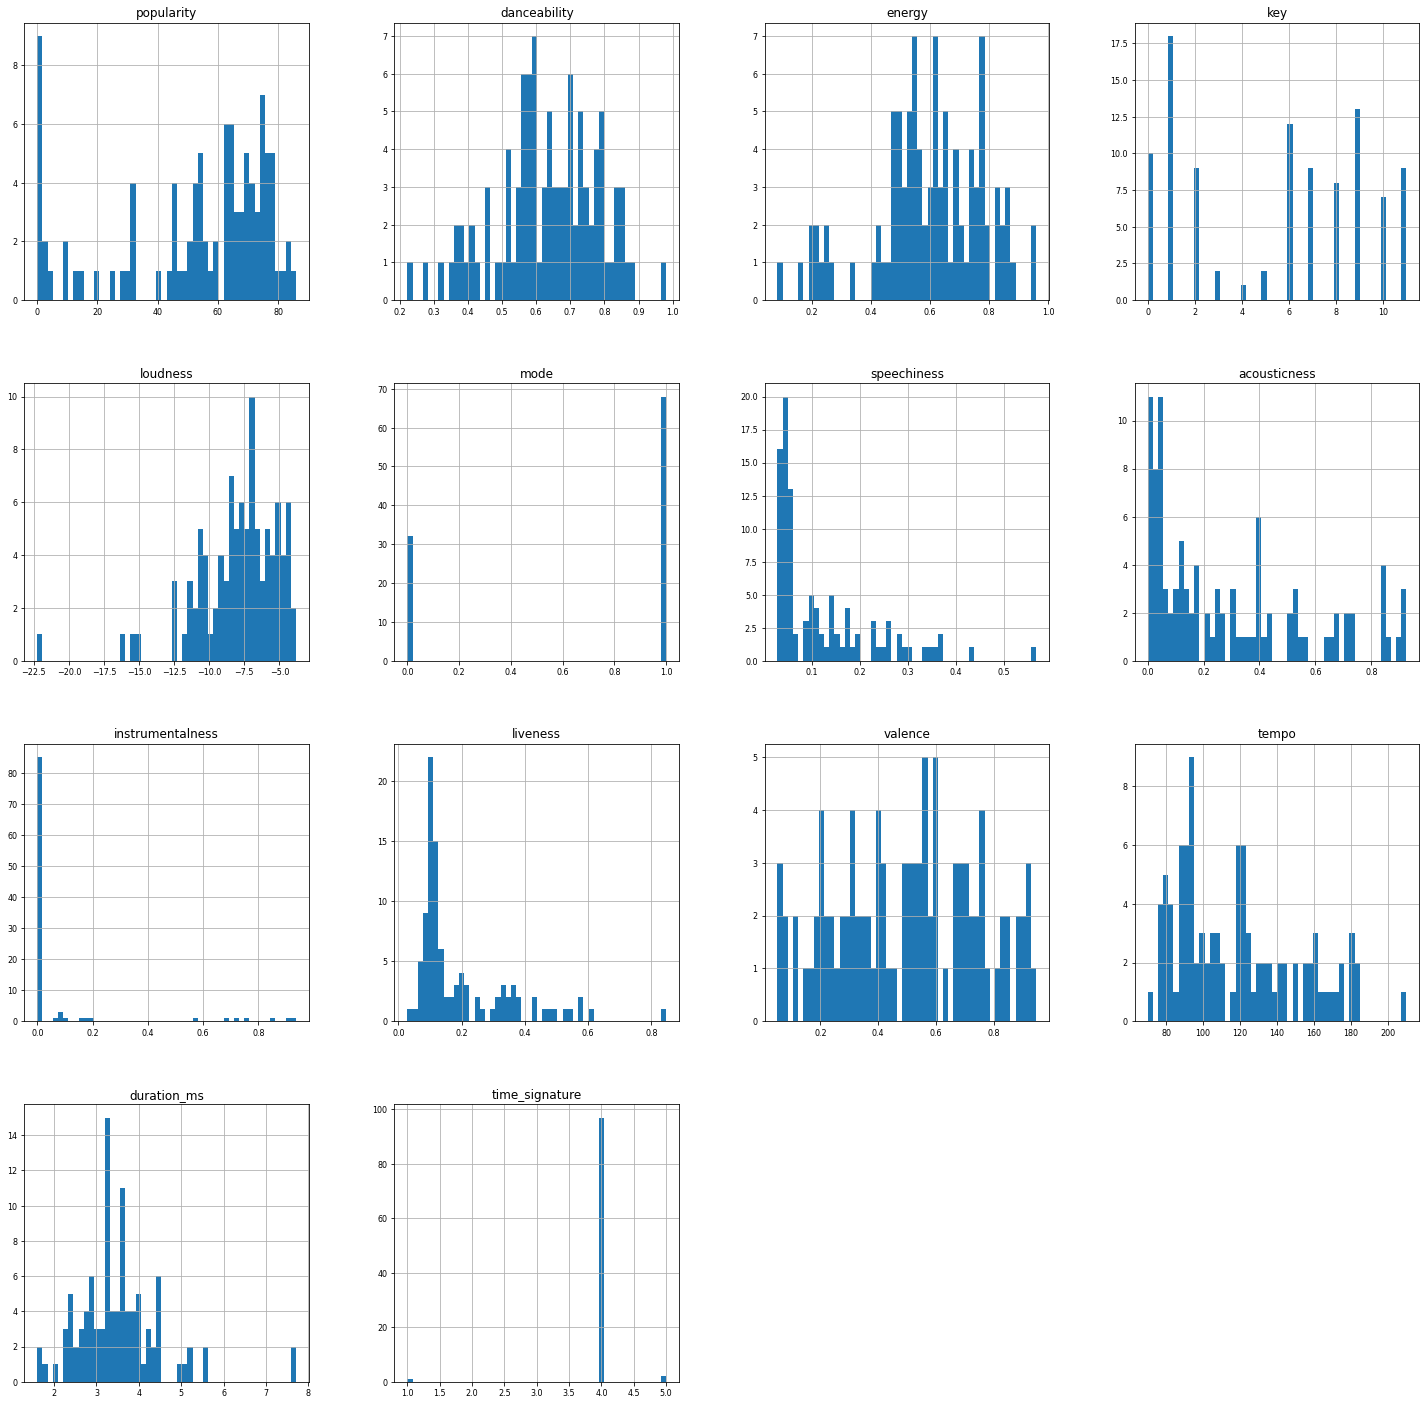
It does not say much but it just implies the fact that I like songs with higher tempos also one key thing is that I do not listen to songs that are generally popular.
Hmm, even I did not know this much about my taste!
That's the beauty of Data Visualization I guess, you just get to know so much of interesting and surprising facts about some data, be it personal too.
Moving on, then I also thought it's also important to know which is the user's most listened artist and album from the playlist so I also visualized it out using bar plots.
This will give us the no of unique artists and albums from the playlist.
artists_data = final_df["artist"].value_counts().head(10)
count_artist = artists_data.index
albums_data = final_df["album"].value_counts().head(10)
count_albums = albums_data.index
# here i am thinking to recommend based on the artist and album this playist has and hence checking which is the most heard artist and album here
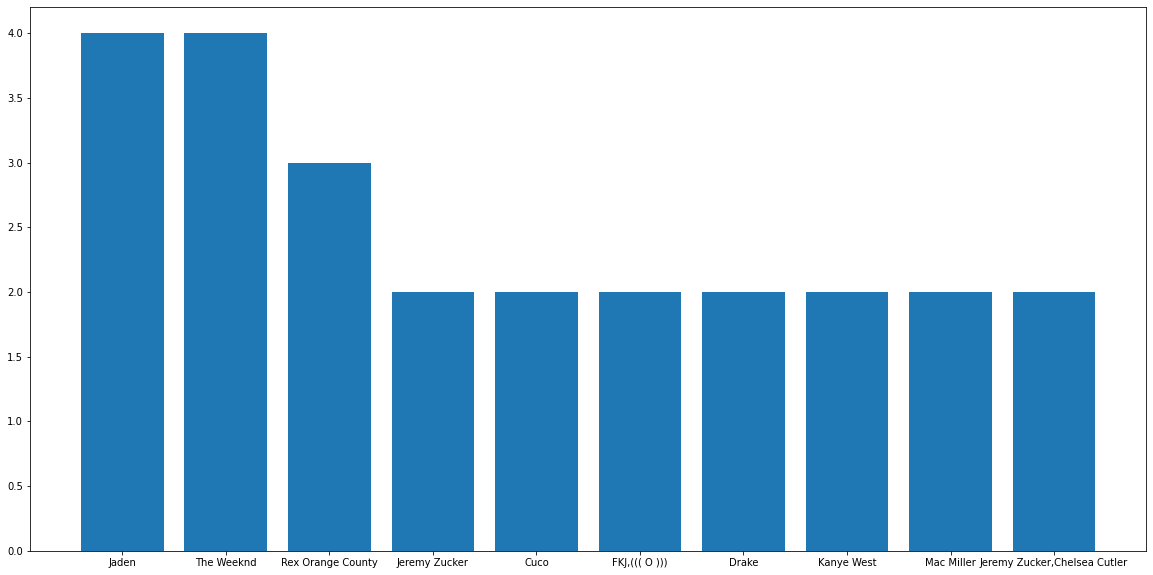
Then just plot a barplot with the count of artists and albums in the playlist shown in the graph.
For Artist,
postionofbars = list(range(len(count_artist)))
plt.figure(figsize=(20, 10))
plt.bar(postionofbars,artists_data)
plt.xticks(postionofbars,count_artist)
For Album,
postionofbars = list(range(len(count_albums)))
plt.figure(figsize=(25, 20))
plt.bar(postionofbars,albums_data)
plt.xticks(postionofbars,count_albums)
Then there are the bar plots for artists and albums,
For Artists,
For Albums,

From here, I came to know I listen to more of Jaden Smith's music and have recently been a fan of Weekend's album "Dawn FM".

Step 3: Understanding the Top 50 Playlist Data
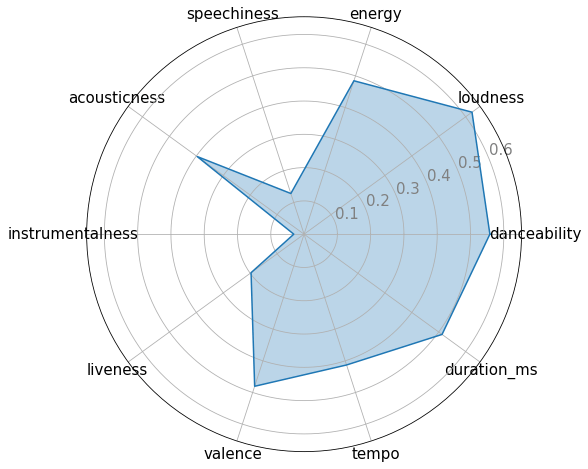
Now I picked up Spotify's "Top 50 Global" playlist which will be used as a reference playlist from which I will pick tracks to recommend. I was doing the same things as above like,
Plotting Radar Charts to know the taste of the general audience.
Plotting Histograms for more in-depth analysis.
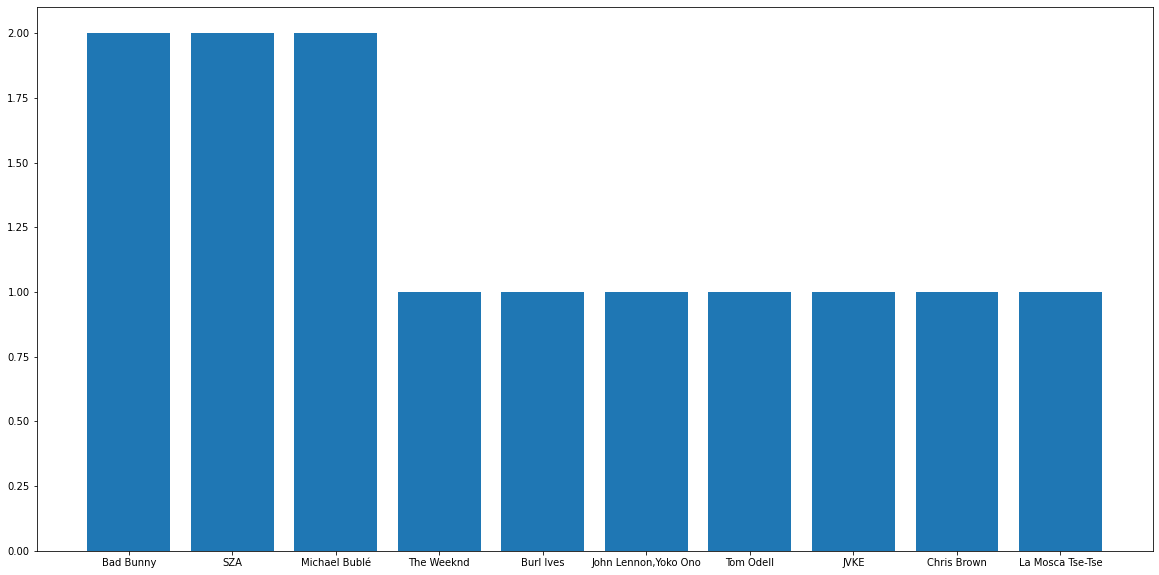
Plotting Bar Graphs to see the most listened artist and albums.
Here are the graphs,
Radar Chart
Histogram

Top Artists Bar Chart
Top Albums Bar Chart
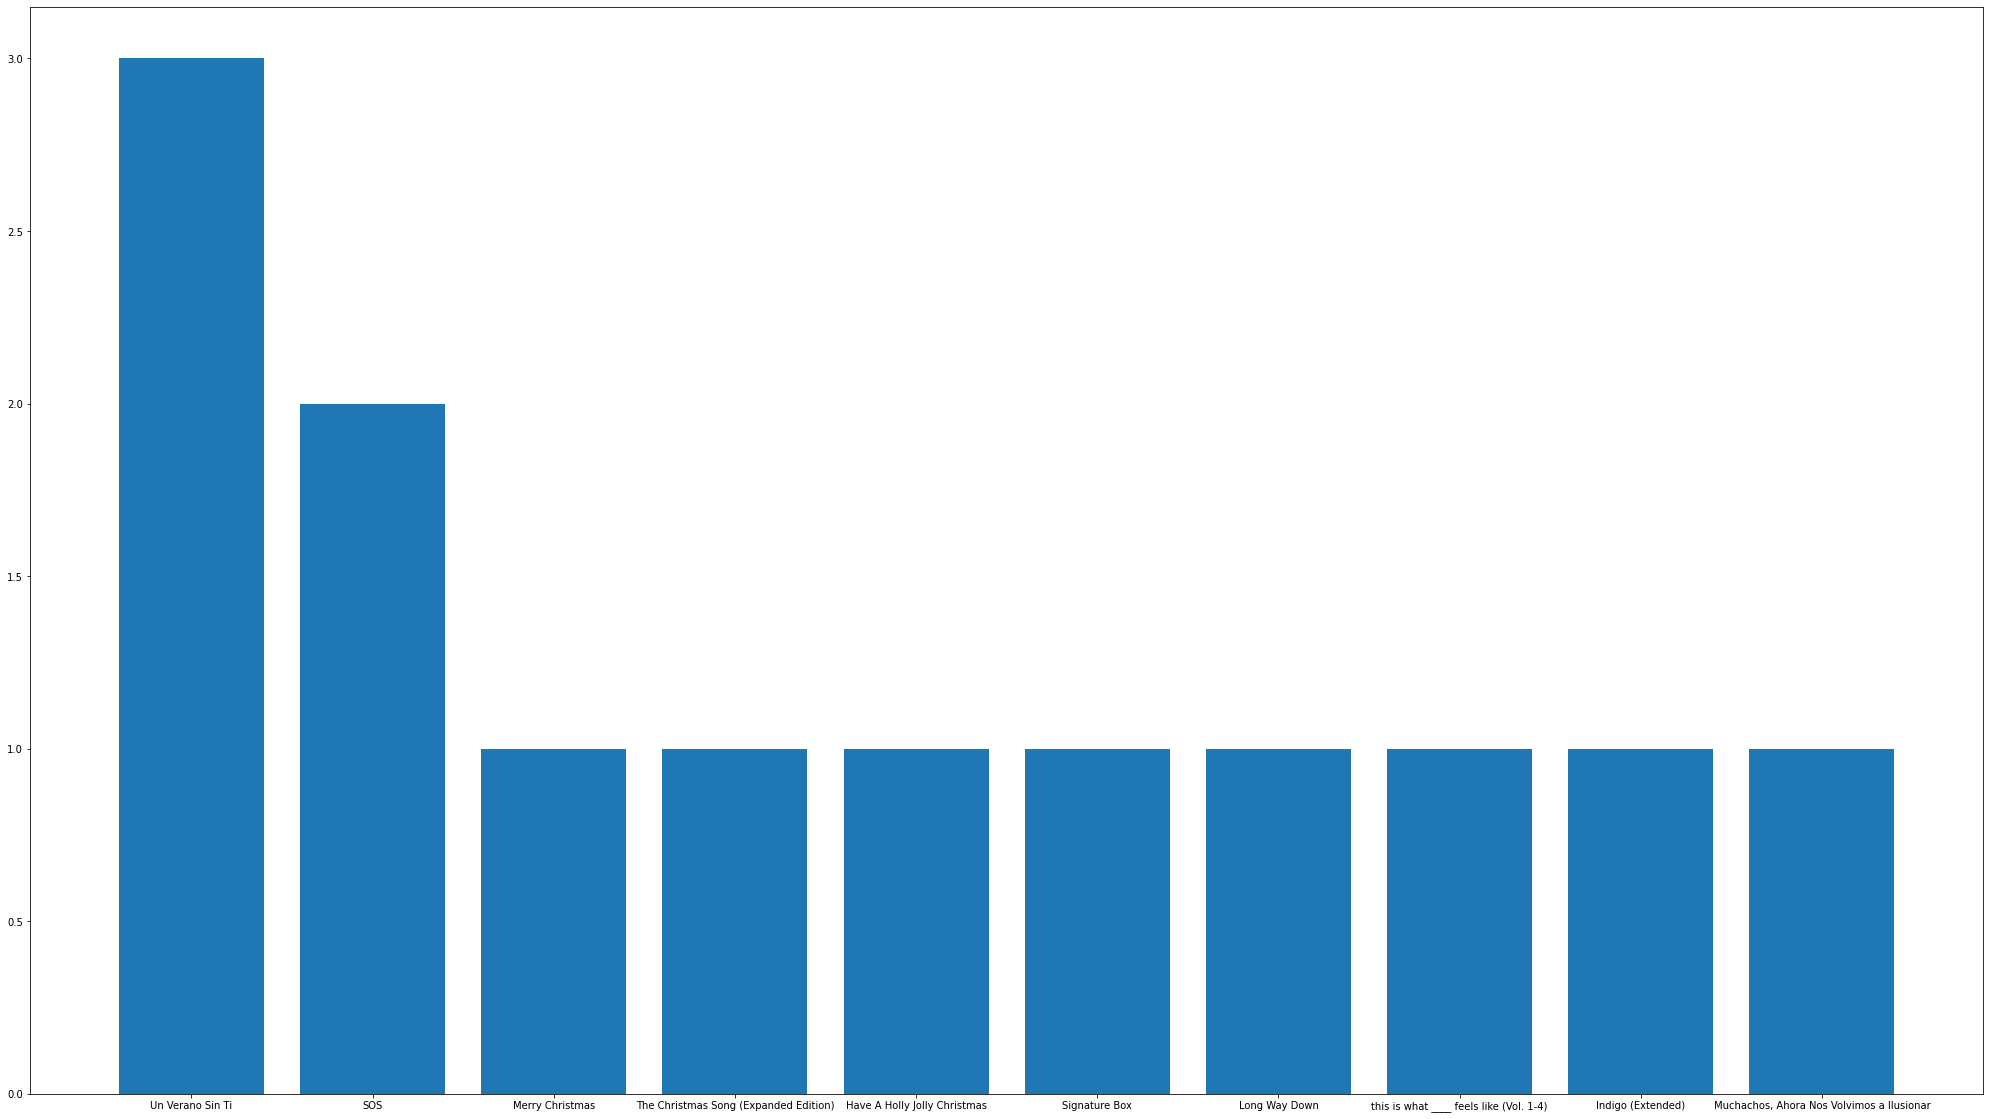
I hope you got a basic idea of what type of music is trending and what artists and albums are being listened to a lot by users of Spotify.
Step 4: Let's Build the Recommendation Engine
Now I will be using a content-based filtering method which is observing which values of particular features is the user positively reacting to so that we can recommend items with the same features and respective values. For example, if someone likes a punk rock song and a classic rock song, then he/she may like a metal song or an alternative rock song.
What is Content-Based Filtering U Ask?
A content-based recommender system tries to guess the features or behavior of a user given the item’s features, which he/she reacts positively to.

The last two columns Action and Comedy describe the Genres of the movies. Now, given these genres, we can know which users like which genre, as a result, we can obtain features corresponding to that particular user, depending on how he/she reacts to movies of that genre. Once, we know the likings of the user we can embed him/her in an embedding space using the feature vector generated and recommend him/her according to his/her choice. During recommendation, the similarity metrics (We will talk about it in a bit) are calculated from the item’s feature vectors and the user’s preferred feature vectors from his/her previous records. Then, the top few are recommended.
Step 4: Let's Build our model
Now, I will link my Google Colab Notebook for your reference so that you can see all the gibberish code I wrote to do all the processes we have discussed till now and also the later ones.
So, we created a new feature in both of our datasets( our playlist and top 50 playlists) called 'metadata' which contains the song title, album and all such categorical data from the dataset. Then we make a vector using the TFIDF Vectorizer, Check out this link to know more. Then I made the latent matrix by using SVD for dimensionality reduction and then using cosine similarity to find similarity scores among the two latent matrices.
from sklearn.metrics.pairwise import cosine_similarity

data_1= np.array(latent_matrix_l_df)[1:50,:50]
print(data_1.shape)
data_2 = np.array(top_latent_matrix_df[1:])
print(data_2.shape)
score_1 = cosine_similarity(data_1 , data_2)[:,0]
data_combine = pd.DataFrame(np.concatenate((data_1, data_2)))

dictDF = {"content":score_1}
print(score_1.shape)
similar = pd.DataFrame(dictDF, index = top_latent_matrix_df[1:].index)
similar.sort_values("content",ascending=False,inplace=True)
# print(similar.head())
print(pred_ids)
for i in pred_ids:
  print(top_final_df[top_final_df["id"]== i]["name"])
Then the content-based (numeric) latent matrices are made from the numerical values of your dataset. We make one common feature called ''features" which contains the normalized score of all the numerical columns for respective datasets.
from sklearn.preprocessing import MinMaxScaler
datatypes = ['int16', 'int32', 'int64', 'float16', 'float32', 'float64']
normarization = colab_top_num_des_df.select_dtypes(include=datatypes)
for col in normarization.columns:
    MinMaxScaler(col)
Then similarly use cosine similarity for both datasets which gives us similarity scores for it and then what we do for the above two similarity matrices is we make them into a 1-D array and then sort the values in descending order to get the highest similarity scores first and we then extract all the data for the id of these corresponding similarity scores.
For Content Based(Numeric) Latent Matrix
aud_1_colab = np.array(colab_num_des_df["features"][:50]).reshape(-1,1)
aud_2_colab =  np.array(colab_top_num_des_df["features"][:50]).reshape(-1,1)
score_1 = cosine_similarity(aud_1_colab , aud_2_colab)[:,0]
dictDF = {"colab":score_1}
print(score_1.shape)
similar = pd.DataFrame(dictDF, index = colab_top_num_des_df.index)
similar.sort_values("colab",ascending=False,inplace=True)
pred_ids = similar[1:].head(11).index
print(pred_ids)
for i in pred_ids:
  pred_track_data = colab_top_num_des_df.loc[i]
  pred_track_id = pred_track_data["id"]
  print(top_final_df[top_final_df["id"] == pred_track_id]["name"])
For Content-Based Latent Matrix
from sklearn.metrics.pairwise import cosine_similarity

data_1= np.array(latent_matrix_l_df)[1:50,:50]
print(data_1.shape)
data_2 = np.array(top_latent_matrix_df[1:])
print(data_2.shape)
score_1 = cosine_similarity(data_1 , data_2)[:,0]
data_combine = pd.DataFrame(np.concatenate((data_1, data_2)))

dictDF = {"content":score_1}
print(score_1.shape)
similar = pd.DataFrame(dictDF, index = top_latent_matrix_df[1:].index)
similar.sort_values("content",ascending=False,inplace=True)
# print(similar.head())
print(pred_ids)
for i in pred_ids:
  print(top_final_df[top_final_df["id"]== i]["name"])
Then for both of these, we get the following songs from the Top 50 Global Playlist accordingly,
From Content Based (Numeric) Filtering,
(50,)
Int64Index([24, 26, 27, 28, 29, 30, 31, 32, 33, 34, 36], dtype='int64')
24    Another Love
Name: name, dtype: object
24    https://api.spotify.com/v1/tracks/7jtQIBanIiJO...
Name: track_href, dtype: object
None
26    golden hour
Name: name, dtype: object
26    https://api.spotify.com/v1/tracks/5odlY52u43F5...
Name: track_href, dtype: object
None
27    Calm Down (with Selena Gomez)
Name: name, dtype: object
27    https://api.spotify.com/v1/tracks/0WtM2NBVQNNJ...
Name: track_href, dtype: object
None
28    LET GO
Name: name, dtype: object
28    https://api.spotify.com/v1/tracks/3zkyus0njMCL...
Name: track_href, dtype: object
None
29    Under The Influence
Name: name, dtype: object
29    https://api.spotify.com/v1/tracks/5IgjP7X4th6n...
Name: track_href, dtype: object
None
30    Mockingbird
Name: name, dtype: object
30    https://api.spotify.com/v1/tracks/561jH07mF1jH...
Name: track_href, dtype: object
None
31    I Ain't Worried
Name: name, dtype: object
31    https://api.spotify.com/v1/tracks/4h9wh7iOZ0GG...
Name: track_href, dtype: object
None
32    Tití Me Preguntó
Name: name, dtype: object
32    https://api.spotify.com/v1/tracks/1IHWl5LamUGE...
Name: track_href, dtype: object
None
33    Ditto
Name: name, dtype: object
33    https://api.spotify.com/v1/tracks/3r8RuvgbX9s7...
Name: track_href, dtype: object
None
34    Die For You
Name: name, dtype: object
34    https://api.spotify.com/v1/tracks/2LBqCSwhJGcF...
Name: track_href, dtype: object
None
36    Holly Jolly Christmas
Name: name, dtype: object
36    https://api.spotify.com/v1/tracks/6tjituizSxwS...
Name: track_href, dtype: object
From Content-Based Filtering,
(49, 50)
(49, 50)
(49,)
22    Made You Look
Name: name, dtype: object
20    Me Porto Bonito
Name: name, dtype: object
34    Die For You
Name: name, dtype: object
48    Sleigh Ride
Name: name, dtype: object
17    Gato de Noche
Name: name, dtype: object
4    Creepin' (with The Weeknd & 21 Savage)
Name: name, dtype: object
44    Efecto
Name: name, dtype: object
15    Feliz Navidad
Name: name, dtype: object
14    Santa Tell Me
Name: name, dtype: object
13    Quevedo: Bzrp Music Sessions, Vol. 52
Name: name, dtype: object
18    Snowman
Name: name, dtype: object
19    Rich Flex
Name: name, dtype: object
46    Sweater Weather
Name: name, dtype: object
42    Bad Habit
Name: name, dtype: object
23    Let It Snow! Let It Snow! Let It Snow!
Name: name, dtype: object
10    La Jumpa
Name: name, dtype: object
24    Another Love
Name: name, dtype: object
40    Miss You
Name: name, dtype: object
12    It's Beginning to Look a Lot like Christmas
Name: name, dtype: object
31    I Ain't Worried
Name: name, dtype: object
37    I Wanna Be Yours
Name: name, dtype: object
32    Tití Me Preguntó
Name: name, dtype: object
38    Underneath the Tree
Name: name, dtype: object
41    Bloody Mary
Name: name, dtype: object
45    DESPECHÁ
Name: name, dtype: object
43    Romantic Homicide
Name: name, dtype: object
27    Calm Down (with Selena Gomez)
Name: name, dtype: object
25    Hey Mor
Name: name, dtype: object
2    Last Christmas
Name: name, dtype: object
49    Happy Xmas (War Is Over) - Remastered 2010
Name: name, dtype: object
6    Rockin' Around The Christmas Tree
Name: name, dtype: object
8    Jingle Bell Rock
Name: name, dtype: object
1    All I Want for Christmas Is You
Name: name, dtype: object
11    I'm Good (Blue)
Name: name, dtype: object
7    La Bachata
Name: name, dtype: object
33    Ditto
Name: name, dtype: object
26    golden hour
Name: name, dtype: object
39    Escapism.
Name: name, dtype: object
3    Unholy (feat. Kim Petras)
Name: name, dtype: object
21    Until I Found You (with Em Beihold) - Em Beiho...
Name: name, dtype: object
9    Anti-Hero
Name: name, dtype: object
30    Mockingbird
Name: name, dtype: object
29    Under The Influence
Name: name, dtype: object
28    LET GO
Name: name, dtype: object
47    Ojitos Lindos
Name: name, dtype: object
16    It's the Most Wonderful Time of the Year
Name: name, dtype: object
5    As It Was
Name: name, dtype: object
35    Here With Me
Name: name, dtype: object
36    Holly Jolly Christmas
Name: name, dtype: object
As you can see in the results, well after the predictions I have personally listened to some of the tracks and they seemed to match my taste and preference in the type of music I often want to listen to so. You can try it out on one of your playlists too and see if you get some new songs that you might like to listen to!
Conclusion
So we have successfully built a recommendation engine that would suggest songs from the top 50 Global songs playlist and it would be based on our taste in music which is derived from our very own playlist that we would often listen to. We used Content-Based Filtering where we did make separate latent matrices for artist and genre-based and another one based on the audio features of the songs in the playlist like acousticness, liveliness and more. I hope this was interesting to read and learn about and in the next one I will try to build a React App which will take the playlist's URL as an input and suggest songs as output, we will use Django as our web server where we will make the latent matrices and send the resultant song's data as a response back to our client. So stay tuned!

